Total Cost of Ownership
of a Full Containers Inspection Equipment,
as an effect of the Choice of its Fill Level
Inspection Technology.
“Electronic Inspector's base price typically represents less than 25% of its Total Cost of Ownership”
Counting the number of technologies today existing for the analytic automated measurement of the fill level in the industrial Food and Beverage Packaging Lines, we encounter at least seven different versions.
Front of so many alternatives, the fundamental question:
“What is the optimal solution providing maximum Quality and minimum costs?”
finds an answer established long time ago by Gartner Group™.
The answer can be formulated in terms of Total Cost of Ownership (TCO), integrated along ten years, for the Full Bottle Inspector devoted to fill level inspection in the out feed of the Filler or of the Labeller Machine. Gartner, Inc.™ defines TCO as the total cost of using and maintaining an analytic automated Quality Control investment over time. TCO calculations include a combination of direct costs:
- hardware,
- upgrades,
- change-overs to new bottle formats,
- operation of the device by the Staff,
- administration,
plus indirect costs:
- end-user operations,
- downtimes.

![]() Total Cost of Ownership of the Electronic Inspectors (also named Bottling Controls) truly paid by Food and Beverage Bottling Plants. Only the purchase price (including installation, startup & commissioning), accounting for 25% is known. 75% accounts for partially hidden or roughly estimated direct and indirect costs, related to change-overs, upgrades, maintenance by external staff of the Vendor, maintenance by internal staff of the Bottler, operation by Production staff, Administration. The mere downtimes until here not cited, were capable in several cases to sum-up over 5 days. Losses-on-production ranging ~67% of the purchasing price paid to acquire the equipment.
Total Cost of Ownership of the Electronic Inspectors (also named Bottling Controls) truly paid by Food and Beverage Bottling Plants. Only the purchase price (including installation, startup & commissioning), accounting for 25% is known. 75% accounts for partially hidden or roughly estimated direct and indirect costs, related to change-overs, upgrades, maintenance by external staff of the Vendor, maintenance by internal staff of the Bottler, operation by Production staff, Administration. The mere downtimes until here not cited, were capable in several cases to sum-up over 5 days. Losses-on-production ranging ~67% of the purchasing price paid to acquire the equipment.
The Total Cost of Ownership is often overlooked and, unfortunately, unbudgeted. So that it implies in the end often huge inaccuracies into the Bottling Factory spending analysis. Most Bottling Companies believe the major extent of their direct costs end at the point of purchase. However, research extended to:
- ~430 Electronic Inspectors commissioned serviced, audited and whose lifetime was later, also in economic terms, followed or audited;
- tens of types of Electronic Inspectors commissioned and serviced and whose lifetime was later, also in economic terms, followed (sum over the different Vendors of all of the different kinds of Electronic Inspector commissioned, e.g.: fill level standalone, case or crate standalone, cap standalone, squeezers standalone PET EBIs in-the-machine, glass or PRB EBIs standalone, label in-the-machine, label standalone, etc.);
- >100 different kinds of inspections by different Vendors, before commissioned and later serviced along their entire lifetime;
shows that an Electronic Inspector's purchasing price typically represents <25% of its TCO, with:
- spare parts replaced during technical maintenance activites by the Staff of the Maintenance Dept. of the same Bottling Plant;
- external technical support, say external Service Technicians’ maintenance activities billed to the Bottling Plant by the Vendors of Electronic Inspectors;
- external technical support during change-overs to new bottle formats, again external Service Technicians’ maintenance activities billed to the Bottling Plant by the Vendors of Electronic Inspectors;
- labour costs of the Production Staff operating the devices;
accounting for the remaining >75%. These aftermarket expenses represent the greatest piece of the Total Cost of Ownership pie and should therefore warrant the highest levels of scrutiny.

![]() The Electronic Inspector's purchasing price, device installation, startup & commissioning included, typically represents <25% of its Total Cost of Ownership. The remaining 75% includes after-sale costs along years of: losses on Production (false rejects), recalls of Production due to poor Quality, downtimes, costs to pay Vendor’s Staff on-site Service and Maintenance activities, out-of-guarantee spare parts, labour of the Plant Production and Plant Maintenance Staff, etc. Losses on Production technology-related, e.g. adopting HF Fill Level Inspection rather than X-rays Fill Level Inspection cost much more than what can be deduced by a mere estimation of False Rejects. The out feed of the Filler or Labeller Machines are the most critical areas of the Bottling Line: one-way conveyors where bottles or, cans reach the maximum speed. There, to falsely reject 0.10% rather than 0.01% along 10 years, increases the Total Cost of Ownership much more than the difference 0.09% because Rejectors are not ideal devices: parts' wearing and timing errors shall introduce downtimes because of jams in the area of the reject Tables and fallen containers.
The Electronic Inspector's purchasing price, device installation, startup & commissioning included, typically represents <25% of its Total Cost of Ownership. The remaining 75% includes after-sale costs along years of: losses on Production (false rejects), recalls of Production due to poor Quality, downtimes, costs to pay Vendor’s Staff on-site Service and Maintenance activities, out-of-guarantee spare parts, labour of the Plant Production and Plant Maintenance Staff, etc. Losses on Production technology-related, e.g. adopting HF Fill Level Inspection rather than X-rays Fill Level Inspection cost much more than what can be deduced by a mere estimation of False Rejects. The out feed of the Filler or Labeller Machines are the most critical areas of the Bottling Line: one-way conveyors where bottles or, cans reach the maximum speed. There, to falsely reject 0.10% rather than 0.01% along 10 years, increases the Total Cost of Ownership much more than the difference 0.09% because Rejectors are not ideal devices: parts' wearing and timing errors shall introduce downtimes because of jams in the area of the reject Tables and fallen containers.
The Key Point: what is the Optimal"
Wavelength to Detect Beverages?
“Physical Laws introduce in the Food and Beverage Packaging process constraints stronger than whatever commercially-oriented suggestions, smiles and accompanying handshakes”
To look for the optimal technology of inspection of the level of water-based liquids in a container means a comparison of their qualities and pitfalls. Comparison of their capability to deternine what property? Surely of the properties “existence and amount of water”, which are what we have to measure in glass, PET or metal bottles, cans’ or kegs’ headspace. We shall attack a single problem by different points: spectral, energetic, chemical. We shall focus in the following sections on the comparison of:
- commercial prices, part of the TCO, paid by the Bottlers to acquire different Technologies of fill level inspection devoted to the same bottling application;
- losses-on-production, strictly related to the chosen Inspector Technology;
- physics of the interaction between electromagnetic radiation and water;
- inspection Quality, strictly related to the chosen Inspector Technology.
The electronic inspectors require constant configuring and maintenance. Ongoing costs related to interventions on sensitivity to enforce the Bottling Company Quality Policy, change-overs, repair and general support (e.g., cleaning) are unavoidable.

![]() Benchmark of three fill level technologies, X-rays, Infrared (IR) and High Frequency (HF) in the electromagnetic spectrum, based on the energies involved by mean of the E = hν fundamental formula (where ν = c / λ, c speed of propagation of em waves in the vacuum, λ wave length, ν frequency, h Planck's constant, E photon’s energy). In the case of the Bottling Controls: a) the energy of a single X-ray photon results ~1000 times greater than that associated to an IR photon, b) the energy of a single IR photon results ~10000000 times greater than that associated to an High Frequency at 21 MHz. X-ray inspection results 10 trillion times ( ! ) more energetic than HF, thus minimising the false rejects rates related to ambient and beverage fluctuating conditions (adapted by
Benchmark of three fill level technologies, X-rays, Infrared (IR) and High Frequency (HF) in the electromagnetic spectrum, based on the energies involved by mean of the E = hν fundamental formula (where ν = c / λ, c speed of propagation of em waves in the vacuum, λ wave length, ν frequency, h Planck's constant, E photon’s energy). In the case of the Bottling Controls: a) the energy of a single X-ray photon results ~1000 times greater than that associated to an IR photon, b) the energy of a single IR photon results ~10000000 times greater than that associated to an High Frequency at 21 MHz. X-ray inspection results 10 trillion times ( ! ) more energetic than HF, thus minimising the false rejects rates related to ambient and beverage fluctuating conditions (adapted by
![]() CC BY-SA 3.0)
CC BY-SA 3.0)

No doubt that choosing, on a case-by-case base, the optimal fill level inspection technology for the particular packaging process, will increase efficiency, expand productivity and truly reduce your TCO cost. In the specific of our fill level inspection case, huge differences on the value of the parts is implied in one or the other technology.
![]() The energy of the photons adopted as interactant when inspecting Fill Level by mean of the Industrial cameras is related to their wavelength ~550 nm. Corresponding to an energy >1000 smaller than that optimal to detect water
The energy of the photons adopted as interactant when inspecting Fill Level by mean of the Industrial cameras is related to their wavelength ~550 nm. Corresponding to an energy >1000 smaller than that optimal to detect water
![]()

X-ray technology implies so much Optoelectronic and Mechanical components, to result of high intrinsic economic value. Economic value also superior to the ten times more energetic Gamma-ray technology, today nearly abandoned because of the non-technical nor Quality Assurance-related reasons, however objectively sound reasons detailed in other pages. In the meantime, as visible by the figure above, representing the electromagnetic spectrum, the X-ray band occupies a portion of the spectrum much more energetic than the High Frequencies, Infra Red and Laser (visible light) Fill Level Inspection alternative technologies named. The correspondance between energy and wave length derives by Special Relativity and Uncertainty Principle. Larger energies correspond to smaller distances: a more energetic wave is sensitive to interactions occurring over shorter distance scales. How much energy is exchanged in the space is a fundamental data. One which conversely quantifies the independance by the continously and unexpectedly changing environmental and productive factors of the adopted measurement system, like:
- temperature of the ambient,
- humidity of the ambient,
- temperature of the beverage.
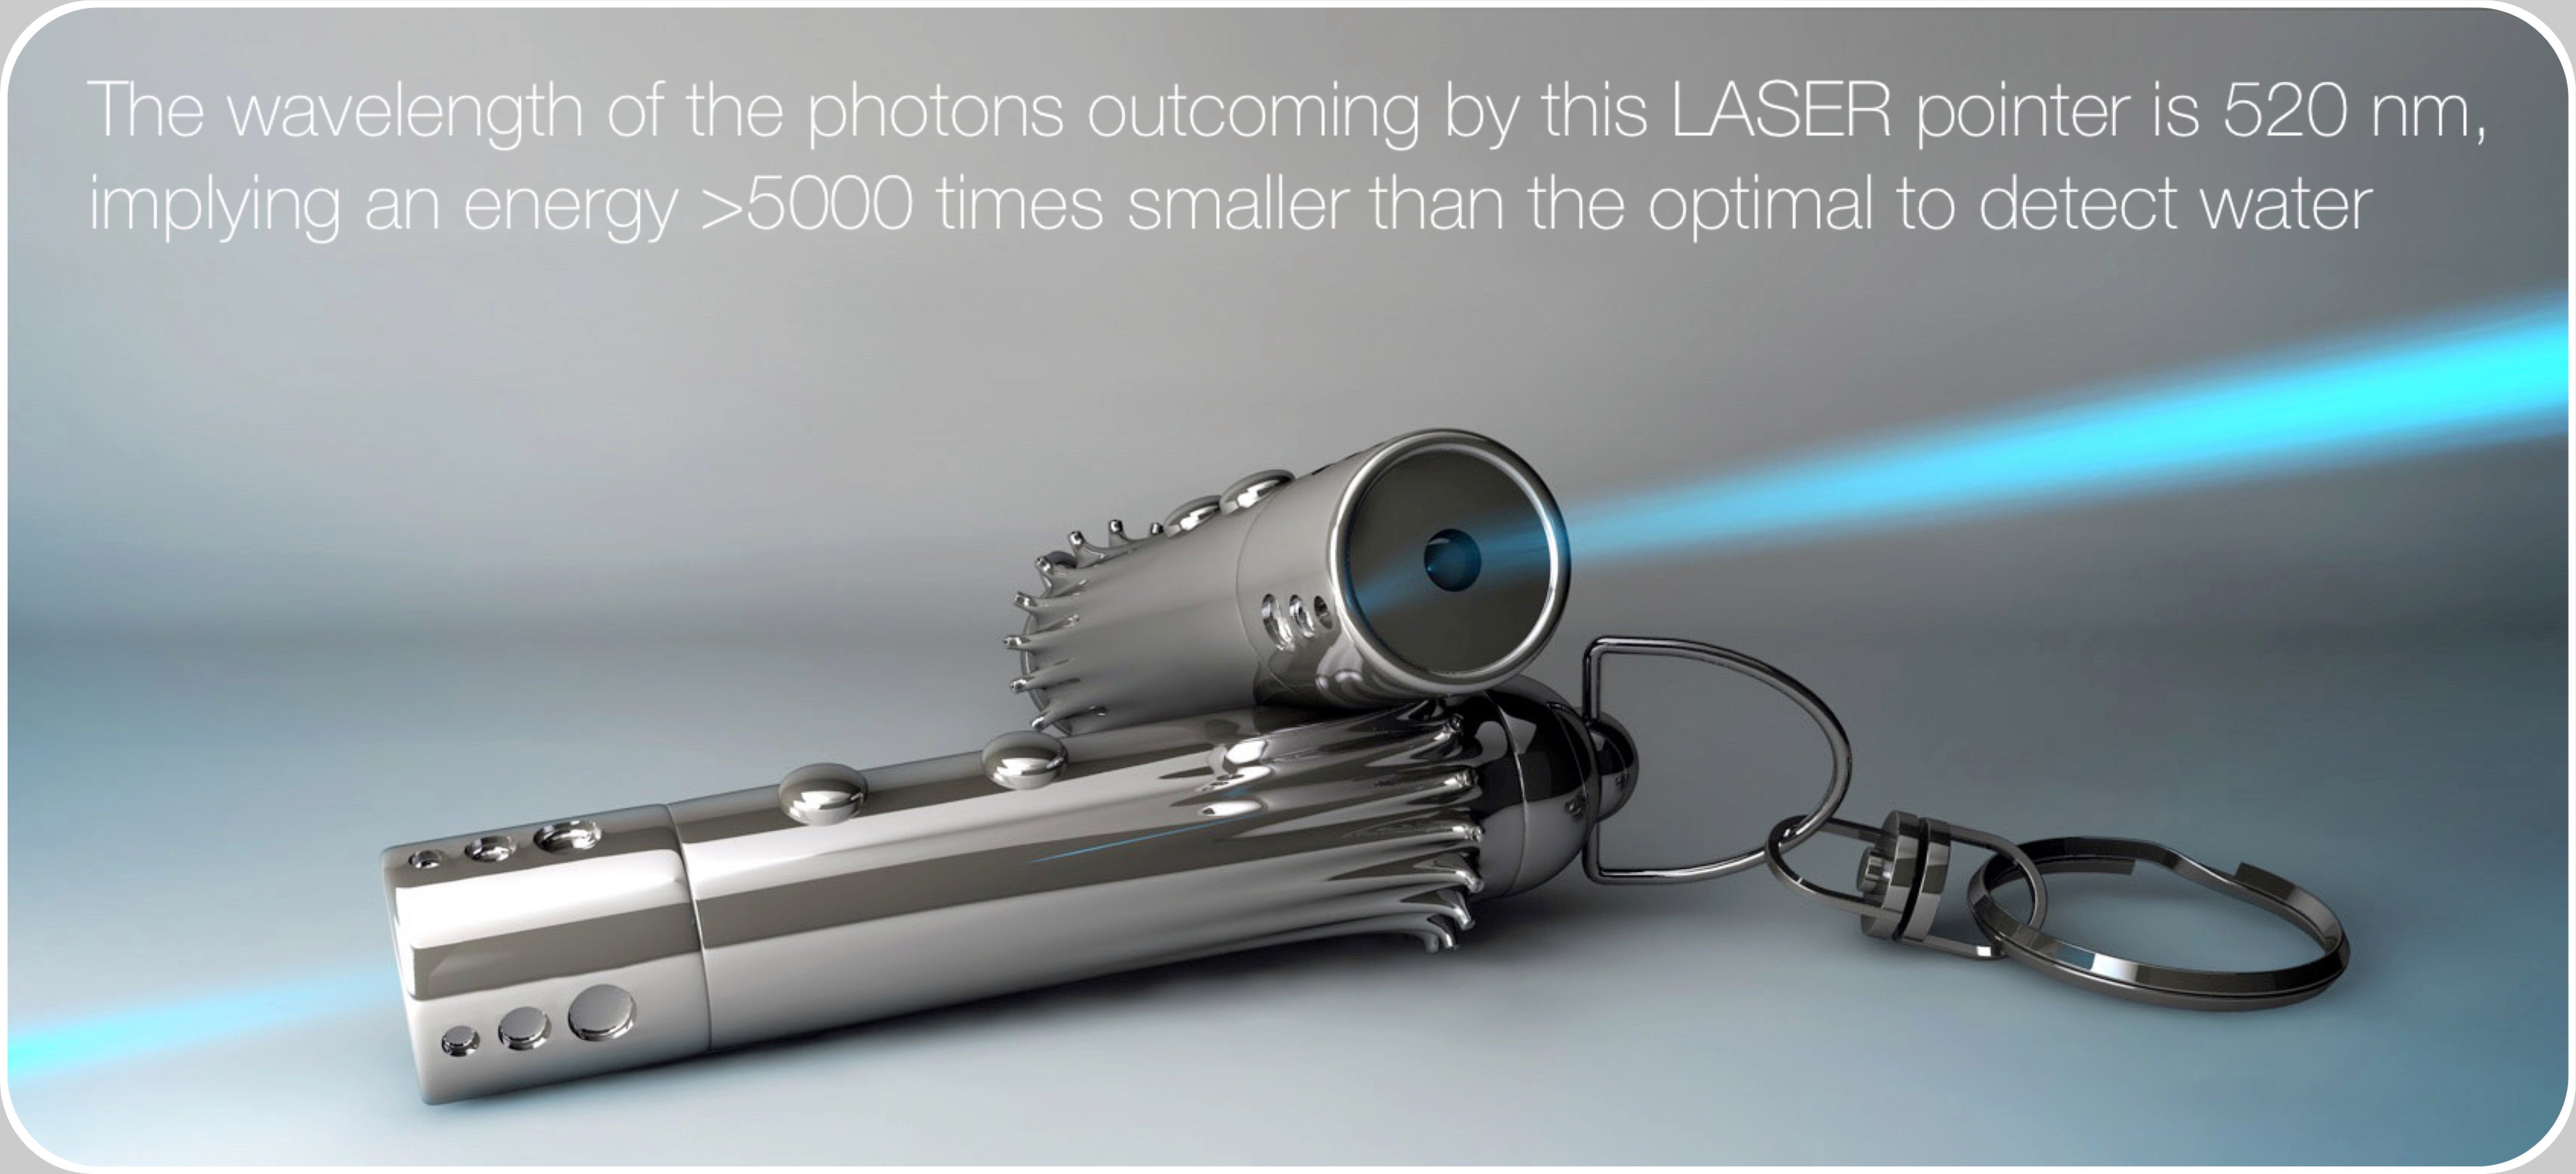
Below, a visible example of some of the problems affecting the evaluation of the level of an aqueous liquid in a glass transparent container, when the interactant is light at visible frequencies, like a green colour LASER light. The LASER light:
- starts to interact with the environment, the gas all around the liquid, immediately after its emission, resulting diffracted,
- when starting its interaction with the upper liquid front surface, it results immediately diffracted below and reflected above,
- photons refracted and diffracted below, results in further reflections along the container's inner sidewalls. Negative factors reducing the imaging Signal-to-Noise ratio.

![]() The wave packets corresponding to water molecules are small and their energy density extremely high, when compared with the wave packets of a common green colour LASER. The interaction forcedly and negatively complicated by multiple diffractions, refractions and reflections whose superposition minimise the imaging or inspection Signal-to-Noise ratio
The wave packets corresponding to water molecules are small and their energy density extremely high, when compared with the wave packets of a common green colour LASER. The interaction forcedly and negatively complicated by multiple diffractions, refractions and reflections whose superposition minimise the imaging or inspection Signal-to-Noise ratio
The key point is the fact that this is happening because the wavelength of the visible light corresponds to energies much smaller than those associated to the de Broglie wavelength of the water in the container. A hint to the fact that not whatever inspection technology to detect water can provide satisfactory results in terms of under or overfillings detection ratio and associated false rejection ratio.
A laymen language explanation

A simplistic explanation for the superiority of the Gamma- or X-rays over all the others fill level inspection technologies, one given in a few laymen words, refers to the comparison with sand. Imagine that the molecules of the liquid in a container be euphemistically represented by sand grains. To know how much liquid is there it is necessary to interact with it. To interact, it’s necessary to provide the interaction agent, or instrument, with energy. What are the dimensions, mass and velocity vector of the interaction agent you’d prefer to use ?
![]() The energies of the photons and of the molecules of water whose amount we have to detect, are related. Relation constraining the optimal fill level inspection technology
The energies of the photons and of the molecules of water whose amount we have to detect, are related. Relation constraining the optimal fill level inspection technology
Interaction-free fill level measurements ?
It has to be remembered that they have yet been demonstrated in 1994 (by A. Zeilinger, et al.) the feasibility and function of the interaction-free measurement systems thinked in 1993 by A. C. Elitzur and L. Vaidman. Quoting its Authors, Quantum Mechanics allows inferring the existence of an object in a nonlocal way via the Aharonov-Bohm Effect, even when the object creates no electromagnetic field outside a certain space region, but only an electromagnetic potential. Even if the object creates no detectable change at a distance, i.e., it interacts with the external world only locally, its location can often be found in a nonlocal interaction-free measurement But, Elitzur and Vaidman were describing extremely slow, delicate Laboratory experiments of Quantum Optics, involving couples of beam splitters crossed by single-photons. [Beam splitters like those we use nearly wherever where is an electronic inspection by camera, but with a parallel terminating there]. And not of the measurements made, i.e. to establish the filling level of beer inside a can flying at the speed 2.4 m/s out of a >90000 cans-per-hour Cans’ Filler Machine. A case where, as an example, the amount of individual photons crossing the beverage and later infeeding the X-rays’ Detector is typically >100000. It is really possible to measure without interaction, but today still impossible in our Industrial Machinery and Environment.
Constrained Fill level measurements
In our technological reality, the energy einstrument of what we’ll decide to use as interaction agent, cannot be in whatever relation with the energy represented by each sand grain eobject whose amount we have to estimate.
Let x designates the “optimal” correlation, corresponding to the maximum Signal-to-Noise ratio between the energy of what is used as interactant and the energy of the object we want to interact.
Then, in our technological world, the following statement is generally false:
∀ x ∈ ℝ : einstrument / eobject = x
and replaced by the true:
∃ x ∈ ℝ : einstrument / eobject = x
Several factors which cannot be excluded during the industrial automated Quality Control measurements (“binary classifications”, or “inspections”, or “controls”), imply well definite enegetic relations. One of these factors is the permanently very short Time to measure, made available by the Production speed constrain. The Time to establish that Quantum correlation which precedes whatever physical measurement, before the following phase when a random variable regarding one of the physical properties of the object is deduced in one of the projections (sample space) of the state space where the object has its full existence (further details here). Time that considering all families of Electronic Inspectors, is comprised between 40 μs and 100 ms. The reason for the constrain is that if:
- einstrument ≪ eobject the interaction is insufficient, and the information shall be deduced with excessive uncertainty.
- eobject ≫ einstrument we are interacting too strictly. An excessive interaction explained in modern quantomechanical terms as that interaction between systems decreasing the information in the marginal distribution of the object inspected. Thus violating the basic requirement of repeatability of the measurements. A way to say that, after a single interaction and measurement, the object is no more the one it has been just an instant before, impeding the following measurements’ repeatability.
Energy Equivalents

The mass of the water
The liquid in the container is mainly composed of a vast collection of molecules of water, whose structure resembles that in the figure at right side. A single molecule of water has a mass of 2.992 x 10⁻²⁶ kg. At a first sight 2.992 x 10⁻²⁶ kg really looks insignificant, but that is an effect of the erroneous perspective of our viewpoint. Readjusting to the proper perspective in terms of energy, size and duration of what we are trying to measure, the energy equivalent of a single molecule of water is huge. The energy equivalent of a single molecule of water may be represented in a way homogeneous to the electromagnetic spectrum, frequencies and energies seen before, by its de Broglie wavelength 0.035933842 nm.
![]() The de Broglie wavelength of the water in liquid phase is ≪1 nm, constraining the optimal wavelength for the electromagnetic waves adopted as interactant
The de Broglie wavelength of the water in liquid phase is ≪1 nm, constraining the optimal wavelength for the electromagnetic waves adopted as interactant
![]() Plane wave associated to a molecule
Plane wave associated to a molecule

Wavelength lying between the Gamma-rays and the X-rays, in the spectrum presented before. 10000 billions of times far from the radio frequency at 21 MHz of the High Frequency inspection and >10000 times far from the visible light Optic-camera inspections. Then, we add another fact well known to the Chemical Engineers operating in the Food and Beverage Quality Control Laboratories. Namely, that the water molecule can be encountered in nature in its simplest unimolecular variant, just in a reduced range of cases. The majority of the water, including the liquid phase in a container, lies in complex macromolecular arrangements similar to that visible here at left side. Molecular arrangements where the Hydrogen-bond plays the chaining role between different moleculs. Is it possible to speak of the wave nature of macromolecolar systems ? Since two decades it was known possible for fullerene C60 molecules. More recently Gerlich, Arndt, Eibenberger, et al. (2011) demonstrated that the wavelike behaviour can be followed in the matter also for huge compounds.
![]() Propagation of de Broglie waves in 1D. The real part of the complex amplitude is blue, imaginary part is green. The probability (shown as the colour opacity) of finding the particle at a given point x is spread out like a waveform, there is no definite position of the particle. As the amplitude increases above zero the curvature decreases, so the amplitude decreases again, and viceversa, resulting in a wave
Propagation of de Broglie waves in 1D. The real part of the complex amplitude is blue, imaginary part is green. The probability (shown as the colour opacity) of finding the particle at a given point x is spread out like a waveform, there is no definite position of the particle. As the amplitude increases above zero the curvature decreases, so the amplitude decreases again, and viceversa, resulting in a wave
![]() Wave packet corresponding to a molecule
Wave packet corresponding to a molecule
The quantum wave nature and delocalization of compounds had been followed up to 430 atoms, with a maximal size of up to 60 Å, masses up to 6910 AMU and de Broglie wavelengths as short as 0.001 nm:
λdB = h/mv ≃ 1 pm
The net result of what before is a structure for whom a de Broglie wavelength can really be defined and is shorter than 0.035933842 nm. Thus moving further up the optimal frequency (or, energy) of the electromagnetic wave adopted as interactant. Up in the Gamma-rays' band. Physics’ response about the optimal way to interact by mean of electromagnetism with a molecule of water, to establish their amount in the fast moving neck of a bottle, the head of a can or a keg, is unanimous. Adopting photons whose wavelength is <0.1 nm. In brief, it is well known to physicists since many decades that they are the Gamma-Rays, the photons with the highest possible energy, the optimal way to interact with the matter. All beverages are matter. Then, still continuing to look the entire question from the laymen viewpoint, it was not an error that made over sixty years ago by the American Engineers. Those true pioneers of the Electronic Inspection for the Beverage Bottling Industry who defined in the Gamma-rays the optimal technology. Fill Level Inspection Technology started using a metal discovered in 1944 (Americium-241) by the group of physicists of Glenn T. Seaborg at the University of California, at Berkeley.
Divergence Angle Does Matter

Now, we’ll front the same question about the identification of the optimum fill level inspection from another viewpoint. What follows has a rock-solid theoretical and experimental base in the Huygens-Fresnel diffraction integral.
![]() Divergence angle of the electromagnetic waves is inversely proportional to their frequency. That’s why X-rays' Fill Level inspection is so superior to all the others (High Frequency, Infrared, LED, Optic with camera)
Divergence angle of the electromagnetic waves is inversely proportional to their frequency. That’s why X-rays' Fill Level inspection is so superior to all the others (High Frequency, Infrared, LED, Optic with camera)

![]() Diffraction of a plane wave at a slit whose width equals the wavelength, illustrates the idea of divergence of Huygens and Fresnel
Diffraction of a plane wave at a slit whose width equals the wavelength, illustrates the idea of divergence of Huygens and Fresnel
In 1678 the great Dutch physicist Christian Huygens conceived what is today known as Huygens-Fresnel integral, telling us that the:
- far-field divergence angle of the electromagnetic waves:
- reaches an asymptotic maximum at an infinite distance,
- is inversely proportional to the frequency of the wave,
- wavefront of a propagating wave of light at any instant is shaped by the envelope of spherical wavelets emanating from every point on the wavefront at the prior instant.
The point 1. before explains in a simple way why the X-rays Fill Level inspection results so penetrating when compared to an High Frequency Fill Level inspection. On practice, the X-rays behave more like particles than the High Frequencies at a frequency of 21 MHz.
Result extended by the French engineer and physicist Augustin-Jean Fresnel and finally carried to its actual mathematical rigour by the German physicist Gustav Robert Kirchhoff:

where:
- λ free-space wavelength of the light,
- U(x,y,z) field amplitude after a distance z (z ≫ λ),
- r = [(x - x′)2 + (y - y′)2 + z2]1/2 cartesian distance in 3D flat space,
- cosθ = z/r obliquity factor,
- k = 2π/λ wavenumber of free space,
- S integration surface or optical aperture,
- θ angle between the unit vector ñ normal to the screen and the unit vector r˜
parallel to the line connecting the points (x,y,z) and (x’,y’,z’),
Frequency-based Comparison of Fill Level
Technologies
Adopting, as a base for normalization of the results, the energy content of the 21 MHz signal (wavelength ~14 m), used to evaluate the presence of water-based liquids in the High Frequency Fill Level Inspection technology, it results straightforward to evaluate the approximate scale of the energy factors involved by different technologies. An example in the Table below:

![]() Shown above the energy factor of three common Fill Level Inspection technologies, normalized to the High Frequency (HF). Its reciprocal ( 1/e ) is an indicator of the independance of the results of any technology by the ambient fluctuations, or the container or beverage conditions. The correspondance between energy and wave length derives by Special Relativity and Uncertainty Principle. Larger energies correspond to smaller distances: a more energetic wave is sensitive to interactions occurring over shorter distance scales. Physical Laws introduce in the Food and Beverage Packaging process constraints stronger than whatever commercially-oriented suggestions, smiles and accompanying handshakes
Shown above the energy factor of three common Fill Level Inspection technologies, normalized to the High Frequency (HF). Its reciprocal ( 1/e ) is an indicator of the independance of the results of any technology by the ambient fluctuations, or the container or beverage conditions. The correspondance between energy and wave length derives by Special Relativity and Uncertainty Principle. Larger energies correspond to smaller distances: a more energetic wave is sensitive to interactions occurring over shorter distance scales. Physical Laws introduce in the Food and Beverage Packaging process constraints stronger than whatever commercially-oriented suggestions, smiles and accompanying handshakes
“Fluctuations and derives of the ambient humidity and temperature, beverage temperature may be considered introducing the equivalent of a Noise superimposed to the Signal.
We have not to forget that what Detectors measure as Signal, derives by the interaction between the Beverage and the electromagnetic radiation, our true measurement device.
That’s why the X-ray fill level inspection offers maximum Quality and minimum losses-on-Production (false rejects) to Bottlers”
These energy factors are assuring low and often negligible dependence of the X-ray inspection by the changing ambient, liquid and container conditions. Fluctuations and derives of the ambient humidity and temperature, beverage temperature may be considered introducing the equivalent of a Noise superimposed to the Signal. We have not to forget that what the Detectors’ measure as Signal, derives by the interaction between the Beverage and the electromagnetic radiation, our true measurement device. That’s why the X-ray Fill Level Inspection offers maximum Quality and minimum losses-on-Production (False Rejects) to Bottlers. To have an idea of the digits implied by the different technologies’ we are considering:
- X-ray solution, selectors, lamps and all of the electronics in its outfeed has an intrinsic price for parts always <7000 € (<9700 $). The life expectancy of the most sensible part, the X-ray generator, is >5 years when operating >330 days/year, on 3 shifts.
- I R solution, has a commercial price always <1000 euros (<1380 $). The life expectancy of the Projector-Receiver system is <10 years, when operating >330 days/year, on 3 shifts. An IR projector illuminates the bottle in the area of the neck, and on the opposite side IR absorption is measured by a detector.
- H F solution has a live-cost for parts: <3000 € (<4150 $). The life expectancy of its most sensible part, the High Frequency bridge, the one whose Medium-Time-Between-Failures (MTBF) is maximised, is <2 years.
Diverging Interests. Net Income of Whom?

Vendors, know the fine detail of these differences and, in exclusive favour of their business overcharge the pricelist of the HF, IR and Laser photosensors’ solutions. Then, let them appear to Bottlers inferior to X-ray in terms of inspection performances, inferior but not so much as really they are, when considering the value of what is there. On practice, imagine the same model of Electronic Inspector, by the same Vendor, where the difference lies in the adoption of HF or X-rays for the fill level inspection. It’ll be discovered that the difference of price exists, but reduced to only (1000 - 2000) euro, (1300 - 2600 $), front of completely different values for the parts and the performances later given to the Bottler. To say that two fill level inspections both reject wiith the same 99.9 % of probability 1 mm of under filling with false rejects the first 0.01 % and the second 0.1 %, means that the first is ten times better than the second. Today, nearly no one Bottler in the World accept any more to be forced to accept one of the two alternatives:
- to falsely reject 1 good bottle each 1000 bottles (0.1 %);
or:
![]() How many correctly filled bottles will be rejected to assure that less than 1 in 1000 underfilled shan’t ?
How many correctly filled bottles will be rejected to assure that less than 1 in 1000 underfilled shan’t ?
to reject with probability 99.99 % only under fillings ≥2 mm, when for small formats of bottles this means to be massively introducing to the Market bottles well below the Worldwide spread 1.5 % limit on filling Legal sale ability. More, since ~12 years some of the Vendors frequently present the High Frequency fill level solution to the Bottling Companies as:
- 'the safe one’,
- 'the one which avoid necessity to contact local Authorities for declarations, inspections and authorisations’.
This “practice” deviates the attention of the Design Technical Departments of the potential Buyer (the Food and Beverage Company), far from the Technology which, comparatively, leaves to the Vendor the minimum net incomes. As cleared with plenty of detail in other pages, this analysis is not valid in the case of Beverage Bottling Lines where the product is the extremely foaming Beer:
- level inspected at Filler Machine immediate out feed;
- it does not exist a second Fill Level Inspection point, typically after the Labeller Machine.
In these cases, and only in these, the inspection only can be an High Frequency model, with the foam compensation optional module added.
When (0.10 - 0.01)% > 0.09 %
“Huygens-Fresnel integral tells us that the far-field divergence angle of the electromagnetic waves:
- reaches an asymptotic maximum at an infinite distance,
- is inversely proportional to the frequency of the wave,
thus explaining why the X-rays behave more like particles than the other lower frequency waves”
Bottlers focusing their attention on the Bottling Line losses-on-production implicit in Vendors’ Technical Guarantees of false rejects like 0.1 %, one bottle each one thousands, should have to reconsider what technological solution really takes care of their interests. Losses on Production Technology-related, e.g. when adopting High Frequency HF Level Inspection rather than X-rays Fill Level Inspection, cost much more than what can be deduced by a mere estimation of False Rejects. We are trying to clear to whom is not accustomed to continously register and evaluate Electronic Inspectors' counters that, because of the cricitity of these areas, rejects arising out of the Filler and Labeller Machines imply the identity referred to false rejects' losses:
(0.10 - 0.01)% = 0.09 %
is no more valid, and replaced by the inequality:
(0.10 - 0.01)% > 0.09 %
Why ? Simply because the outfeed of the Filler or Labeller Machines are particularly critical areas of the entire Bottling Line. One-way conveyors where bottles (or, cans) reach the maximum possible speed. To falsely reject 0.10 % rather than 0.01 % along 10 years, increase the Total Cost of Ownership much more than the difference 0.09 %.
This, because Rejectors (also named Ejectors):
- are not ideal devices;
- were not guaranteed to be ideal devices;
- shall never be ideal devices.

![]() The out feed of the Filler or Labeller Machines are a particularly critical areas of the entire Bottling Line: one-way conveyors where bottles (or, cans) reach the maximum possible speed. Adopting an unproper Technology to reject defects in these areas, e.g. 0.10 % rather than 0.01 % along 10 years, increases the Total Cost of Ownership much more than the difference on Production losses 0.09 %. Rejectors are not ideal devices: their pneumatics’ parts wearing, progressive extension of the conveyor belt and other factors introduce increasing timing errors which, in the end, create downtimes because of jams in the area of the reject Tables and fallen containers. Downtimes entering in the TCO
The out feed of the Filler or Labeller Machines are a particularly critical areas of the entire Bottling Line: one-way conveyors where bottles (or, cans) reach the maximum possible speed. Adopting an unproper Technology to reject defects in these areas, e.g. 0.10 % rather than 0.01 % along 10 years, increases the Total Cost of Ownership much more than the difference on Production losses 0.09 %. Rejectors are not ideal devices: their pneumatics’ parts wearing, progressive extension of the conveyor belt and other factors introduce increasing timing errors which, in the end, create downtimes because of jams in the area of the reject Tables and fallen containers. Downtimes entering in the TCO
Their parts’ wearing, the progressive extension of the conveyor belt and several other factors, introduce progressively increasing errors on rejection timing. These, in the end, create downtimes because of jams in the area of the Rejection Tables and fallen containers. To clear eventual dobts, it is enough to ask about to the Production Operators caring the Filler and Labeller Machines. Ask them about those errors of the Rejector, each one time causing small disasters… They, your Staff, are the best witnesses to confirm the solidity of this scenario, because of the physical efforts they personally accomplish, on a daily base, to recover situations with frequent fallen bottles or jams, until restarting the Production flow. A rain of micro-stops of Production avoidable by mean of a different Technology of inspection.
Quality and Production.
Not Quality or Production
Electronic Inspectors’ guarantees frequently state that false rejects shall be <0.1 % when detecting >2.0 mm of underfilling with probability >99.99 %. In the reality, such a way to guarantee hides inaccuracies of the High Frequency inspection system.
False rejects that in the High Frequency fill level inspection are a superposition (or, sum) depending on more than a dozen variable factors, some of them also interacting, with their permutations running into the thousands… Manufacturerss, to avoid to be paying, along the packaging line’s expected service life ranging (10 - 15) years, the cost of a false reject like 1 correctly filled bottle erroneously rejected at every 1000 bottles, will be compelled to reduce sensitivities yet as low as (2 - 3) mm. Reduce the sensitivity thresholds to the values allowing no necessity to readjust sensitivity each (1 - 2) months. For the High Frequency Fill level Inspection this means a downgrade to 5 mm rather than the 2.0 mm received guaranteed >99.99 % with associated false rejects ratio <0.1 %.

![]() ROC-curve of a Fill Level inspection. Imagine to pass 1000 times a glass test container through one and the same Electronic Inspector equipped with a dual Fill Level Inspection: X-ray and High Frequency (or, Optic with camera). Alternatively enabling detection of the first or second inspection system. In the meantime, check one-by-one all rejects attributed to the Fill Level Inspection and add also these to the final two statistical distributions of the hits and misses (True Positives, False Positives, True Negative and False Negatives). You’d discover the bold difference between these technologies in the marked spreading of the High Frequency or, Optic inspections' distributions. More, if you’d repeat along one year on a monthly base the same identical test, you’d also see that, keeping constant the Fill Level sensitivity threshold parameter (never decreasing nor increasing it), the distribution could be more spread than that recorded 2-3 months before, implying False Rejects (False Positives). False rejects that in the High Frequency- and Optic-Fill Level inspections are a superposition (or, sum) depending on more than a dozen variable factors, some of them also correlated, with their permutations running into the thousands... To prevent the observed False Rejects, you are finally “compelled” to reduce the sensitivity of the High Frequency- or Optic-inspections. What does not happen with the X-ray Fill level Inspection (abridged by
ROC-curve of a Fill Level inspection. Imagine to pass 1000 times a glass test container through one and the same Electronic Inspector equipped with a dual Fill Level Inspection: X-ray and High Frequency (or, Optic with camera). Alternatively enabling detection of the first or second inspection system. In the meantime, check one-by-one all rejects attributed to the Fill Level Inspection and add also these to the final two statistical distributions of the hits and misses (True Positives, False Positives, True Negative and False Negatives). You’d discover the bold difference between these technologies in the marked spreading of the High Frequency or, Optic inspections' distributions. More, if you’d repeat along one year on a monthly base the same identical test, you’d also see that, keeping constant the Fill Level sensitivity threshold parameter (never decreasing nor increasing it), the distribution could be more spread than that recorded 2-3 months before, implying False Rejects (False Positives). False rejects that in the High Frequency- and Optic-Fill Level inspections are a superposition (or, sum) depending on more than a dozen variable factors, some of them also correlated, with their permutations running into the thousands... To prevent the observed False Rejects, you are finally “compelled” to reduce the sensitivity of the High Frequency- or Optic-inspections. What does not happen with the X-ray Fill level Inspection (abridged by
![]() Jutta234/CC BY-SA 3.0/2006)
Jutta234/CC BY-SA 3.0/2006)

Such a sensitivity reduction is a precursor to a permanent conflict between duties and goals of the Quality Control and Production Departments. It is relevant to understand that the true causes for such a conflict originate out of the Beverage Bottling Factory (see section above: “Diverging Interests”). Important to choose in favour of Quality and Production, not one or the other. Nominal target minus 1.5 % is the maximum underfilling which can be legally sold on the Market by Bottlers. For a 1500 ml bottle it implies an amount of 22.5 ml of content, detectable by HF fill level inspection with relatively high Signal-to-Noise ratio. But, what about a 500 ml bottle or smaller ? Then, they’ll be only 7.5 ml of liquid difference than the average content, say a minimum amount of liquid that a low-energy technology like the High Frequency has to interact with. Implying a measurement with huge relative errors, a synonimous of false rejects.
![]() A 1.0 mm underfilling amounts to ~30 ml of missing content in the 2000 ml bottles like these. A format where the legal saleability content equals 30 ml. Enough to be rejected with high Signal-to-Noise ratio and low false rejects also by the low performant High Frequency Fill Level Inspection. But, for a bottle format 500 ml the legal saleability limit corresponds to a missing content just 7.5 ml. Too little to be detected with high Signal-to Noise ratio by the High Frequency Fill Level Inspection
A 1.0 mm underfilling amounts to ~30 ml of missing content in the 2000 ml bottles like these. A format where the legal saleability content equals 30 ml. Enough to be rejected with high Signal-to-Noise ratio and low false rejects also by the low performant High Frequency Fill Level Inspection. But, for a bottle format 500 ml the legal saleability limit corresponds to a missing content just 7.5 ml. Too little to be detected with high Signal-to Noise ratio by the High Frequency Fill Level Inspection
Case Study
The Brewery which considered the Technical
Guarantees part of a Contract to be honoured
To the date we lived a long row of real cases. Between these, we also remember who, how, where and when, on behalf of a truly great Brewery:
- Signed a gigantic Contract, including many GRB Bottling Lines, buying by mean of an OEM also some eletronic inspectors equipped with the High Frequency Fill Level Inspection;
- let them be installed in the outfeed of what were in that moment the fastest existing GRB Filler Machines of the entire Planet;
- reality gets out soon: illusory Technical Guarantees. Same pattern yet bitterly felt by many other Bottlers in the World. A situation requesting the Brewery to decide what, one way or another, was an auto-goal:
- downgrading its own Quality Control Policies and Standards under the Legal saleability levels, reducing the sensitivity threshold in the Inspectors so to let bottles underfilled ≫1.5 % pass undetected and unrejected;
- or, to cut along following 15 years the entire beer Bottling Line Production efficiency with the micro-stops deriving by the fallen bottles and jams implicit in extremely high levels of false rejects, plus the Production losses implicit in the false rejects;
- imposed to the OEM (and the Inspectors’ Vendor) to respect the Contract. In no Contract is written that “a Bottler shall have Quality or Production”, rather than that Quality and Production shall be simultaneously given. Production including some specified losses (mechanical efficiency + false rejects);
- Vendor kept on-site nearly 6 months a Service Technician;
- Several months after the telenovela started to be expensively staged, the Electronic Inspectors were ...thrown out. The Brewery compelled the OEM to replace them with inspection equipments by a Vendor's Competitor;
- Competitor’s equipments were nothing better than the others, equipped with similar High Frequency fill level inspections. But, with a full knowledge of what happened to the other Vendor, the Competitor cared to sign only goals they really could fulfill.

![]() Bottlers to avoid be paying along the Bottling Line expected lifetime ranging (10 - 15) years, the cost of a false reject like 1 good bottle erroneously rejected each 1000 bottles, shall be compelled to reduce sensitivities yet low like (2 - 3) mm. A reduction on sensitivity creating a permanent conflict between duties and goals of Quality Control Department and Production Department. It is relevant to understand the causes for such a conflict originate out of the Beverage Bottling Factory. But, what about a 500 ml bottle or smaller ? Then, they’ll be only 7.5 ml of liquid difference than the average content, say a minimum amount of liquid that a low-energy technology like the High Frequency has to interact with. Implying a measurement with huge relative errors, a synonimous of false rejects.
Bottlers to avoid be paying along the Bottling Line expected lifetime ranging (10 - 15) years, the cost of a false reject like 1 good bottle erroneously rejected each 1000 bottles, shall be compelled to reduce sensitivities yet low like (2 - 3) mm. A reduction on sensitivity creating a permanent conflict between duties and goals of Quality Control Department and Production Department. It is relevant to understand the causes for such a conflict originate out of the Beverage Bottling Factory. But, what about a 500 ml bottle or smaller ? Then, they’ll be only 7.5 ml of liquid difference than the average content, say a minimum amount of liquid that a low-energy technology like the High Frequency has to interact with. Implying a measurement with huge relative errors, a synonimous of false rejects.
Conclusions
Graphene knows the price paid for almoist 500 analytic automated quality assurance equipment or, (electronic inspection systems) by seven different Vendors selling ~80% of all aggregated annual global orders. Its staff started, installed, commissioned them all, then followed two decades of their lifetime servicing these devices. We are aware of the TCO for the Bottlers, following each one kind of fill level inspection Technology, when reaching the following conclusions.
X-ray is the fill level inspection solution:
- maximising Quality;
- minimising Losses-on-Production (false rejects) of Bottling Lines;
- minimising Vendors’ incomes;
- minimising the Total Cost of Ownership weighing on Bottlers.
Links to other topics:
- Electromagnetic Measurements of Food and Beverages: an Information Retrieval problem
- Near-Field 3D
- Physics of Triggering
- Fill level inspection tech: a TCO point of view
- What Detectors detect ?
- Electronic Inspectors’ nonclassic components
- What Today Is a "Root Cause"
- Measures in a Decohering Environment


