Links to the pages:
Water, dielectric in a resonant circuitRefer to the image below on right side, showing the conical section of a bottle neck, filled with beverage when passing thru a bridge. In the following we are naming High Frequency bridge a sensor presenting two metal plates directed toward the liquid in the neck of the bottle. …

Introduction
We’ll start here to examine the phenomenas underlying the High Frequency Fill Level Inspection of beverages based on water. Described also effects on the inspection due to ambient fluctuations or derives of the Temperature or Humidity. At first sight, these may appear purely theoretical subjects.
They'll acquire their full relevance and explanatory power in the following pages devoted to the way the HF inspection measures the level of a water-based liquid in a bottle. It is important to understand that Electronic Inspectors when operating in a Beverage Bottling Line, are collections of Measurement devices not allowed to accomplish their functions in the optimal conditions: a Laboratory.
Close-up on Water
Water is a polar molecule, meaning that there is an uneven distribution of electron density. Water has a partial negative charge near the Oxygen atom due the unshared pairs of electrons, and partial positive charges near the Hydrogen atoms.
The electrostatic attraction between the partial positive charge near the Hydrogen atoms and the partial negative charge near the Oxygen, results in the formation of a Hydrogen bond. In absence of electromagnetic fields, the spatial orientations of water bonds and molecules are random, meaning there is no one preferential direction.

A polar molecule is a molecule with opposite charges on the opposite sides. The reason why a water molecule is polar is due to its ‘V' shape. Instead of spend their time around every atom in the molecule, the (negatively charged) electrons spend their time around the Oxygen atom, while the Hydrogen atoms are left alone, then remaining positive. Because of this polarity, water molecules can attract one another and stick together, thus forming water. We’ll re-encounter end deepen the polarisation of the water later in the text, because of its relevance for our Beverage Quality Control application.
![]() High Frequency fill level inspection bridge, on the left side, preceded by a LASER trigger photocell to whose signal are referred also fill level inspection measurements. Shot in a PepsiCo® Bottling Line on the Arabian side of the Persian Gulf
High Frequency fill level inspection bridge, on the left side, preceded by a LASER trigger photocell to whose signal are referred also fill level inspection measurements. Shot in a PepsiCo® Bottling Line on the Arabian side of the Persian Gulf
The Basic Bond of a Water Molecule

A Hydrogen atom is made up of one positively charged proton that is orbited by one negatively charged electron (see figure on right side). The Oxygen atom has eight protons (positive particle) and eight neutrons (neutral particles) in its nucleus. A nucleus surrounded by eight electrons. Because of the structure of Oxygen, they exist two open spots open in the electrons’ cloud. These spots are filled when a Hydrogen atom is in proximity of the Oxygen.
When Hydrogen bonds with Oxygen, the electrons that have bonded are formed into five pairs of ten electrons:
- one pair gives existence to the Oxygen atom's inner electron cloud;
- two pairs form the Oxygen atom's outer electron cloud;
- two remaining pairs form the O-H bonds, which create the polar molecule H2O.
![]() Hydrogen bonds are labeled as Negative [-] Oxygen atoms bond to the positive [+] Hydrogen atom. Each water molecule can make or accept two H-bonds.
Hydrogen bonds are labeled as Negative [-] Oxygen atoms bond to the positive [+] Hydrogen atom. Each water molecule can make or accept two H-bonds.
The role of Hydrogen in Water

Some of the features of water due to Hydrogen bonds are represented in the figures and video above and below. Also the familiarly represented aspect for a drop of water derives by the H-bond extended to a macromolecular system with many participating molecules. We can think of this attraction as water molecules tending to stick together, and the results are interesting. This strong electrostatic attraction between Hydrogen atoms on one water molecule to Oxygen atom on another is called Hydrogen Bonding, or H-bonds. The video below has been shot to water, one of the most basic ingredient of the Food and Beverage Industry. Thanks to its frame rate of 2000 frames-per-second, ~100 times higher than human capability, illustrates the fine details of the process.
Because of Hydrogen bonds, water has many of its known features. The partial charges and dipole for the water molecule are shown in Figure on right side. These partial charges result in water molecules being strongly attracted to one another in the liquid phase. In other terms, for a group of water molecules, the positively charged H-atoms are electrically attracted to the negatively charged O-atoms.
![]() Partial charges are the origin of the strong reciprocal attraction of molecules in the liquid phase named water
Partial charges are the origin of the strong reciprocal attraction of molecules in the liquid phase named water

![]() Hydrogen-bonds are the origin of the bubbles of water and the mechanism hidden in the background of something whose far reaching consequences we all recognise. In the reality, no spherical external surface exist around the drop of water here depicted, rather a nebular cloud of electrons and (rare events) of nucleons
Hydrogen-bonds are the origin of the bubbles of water and the mechanism hidden in the background of something whose far reaching consequences we all recognise. In the reality, no spherical external surface exist around the drop of water here depicted, rather a nebular cloud of electrons and (rare events) of nucleons
Video shot to water, the most common basic product of the Food and Beverage Industry (abridged by footage by D. Whitaker and C. Pantel)
HF Fill Level Inspection, in Synthesis

In synthesis, the High Frequency (HF) fill level inspection considers the liquid and/or gas in the neck of the glass or PET or PRB container as the dielectric of a Capacitor in a resonant circuit. The circuit is closed by mean of the Earth connection to the metal mass of the steel of the Conveyor, immediately under the HF fill level bridge where the bottle is inspected. A Capacitor is a device used for storing electrons. It normally consists of two conducting plates with an interposed dielectric material. The property named Capacity, exists also in absence of electric current applied to the Capacitor by a Generator. This, because Capacity originates by the mere presence of electrons and their positively charged counterpart, protons in the atoms of metal. From a macroscopic classic perspective, the capacity depends on the metallic surface of the plates, their geometry and distance and, what is most important for our application, the kind of dielectric interposed between the plates.

![]() Model of Hydrogen bonds between molecuels of water (figure cs.wikipedia.org/Qwerter/CC-BY-SA 3.0)
Model of Hydrogen bonds between molecuels of water (figure cs.wikipedia.org/Qwerter/CC-BY-SA 3.0)
![]() Liquid status for water and its molecular molecular arrangement, relevant for Bottling Controls, in absence of external electromagnetic fields and in the standard conditions of temperature and pressure
Liquid status for water and its molecular molecular arrangement, relevant for Bottling Controls, in absence of external electromagnetic fields and in the standard conditions of temperature and pressure
The following video (credit University of Cambridge, United Kingdom) illustrates in what a way a dielectric affects the Capacity of the Capacitor:
The beverage and gas in the bottle neck, summed to the humidity in the air and the air between neck and HF sensor constitute the equivalent of the dielectric of a Capacitor. Different levels of beverage in the bottle neck reproduce different values for a physical property of the Capacitor named Dielectric Permittivity. In the figure below on right side, some Capacitors in welded on an electronic printed circuit board

Bottle’s Neck Dielectric Permittivity
The dielectric constant is a property related to the permittivity of the material. Permittivity is a quantity that describes the effect of a material on an electric field: the higher the permittivity, the more the material tends to reduce any field set up in it. Since the dielectric material reduces the field by becoming polarised, an entirely equivalent definition is that the permittivity expresses the ability of a material to polarise in response to an applied field. The dielectric constant (sometimes called the ‘relative permittivity’) is the ratio of the permittivity of the dielectric to the permittivity of a vacuum, so the greater the polarisation developed by a material in an applied field of given strength, the greater the dielectric constant will be.
![]() Electric capacitors. All physical phenomena hinted in these sections are not something whose validity is limited to electronic components like these. Wherever exists at least an electron or a group of those quarks commonly named proton, these phenomena exists. Meaning they can be estimated before and measured later, also for a simple conductor of copper
Electric capacitors. All physical phenomena hinted in these sections are not something whose validity is limited to electronic components like these. Wherever exists at least an electron or a group of those quarks commonly named proton, these phenomena exists. Meaning they can be estimated before and measured later, also for a simple conductor of copper
In general, the more available polarisation mechanisms a material possesses, the larger its net polarisation in a given field will be and hence, the larger its dielectric constant will be. κ and ε are two common symbols for the same concept of dielectric permittivity. Dielectrics becomes polarised in an electric field. Now imagine switching the direction of the field, reproducing an electromagnetic alternative field. The direction of the polarisation will also switch in order to align with the new field. This cannot occur instantaneously: some time is needed for the movement of charges or rotation of dipoles.
If the field is switched, there is a characteristic time that the orientational polarisation (or average dipole orientation) takes to adjust, called the relaxation time. Typical relaxation times are ~ 0.01 ns. Therefore, if the electric field switches direction at a frequency higher than ~ 100 GHz, the dipole orientation cannot follow the alternating field, the polarisation direction is unable to remain aligned with the field, and this polarisation mechanism ceases to contribute to the polarisation of the dielectric.
The bottle in an Electromagnetic Field
In an alternating electric field both the ionic and the electronic polarisation mechanisms can be thought of as driven damped har- monic oscillators (like a mass on a spring), and the frequency dependence is governed by resonance phenomena. This leads to peaks in the plot of the relative dielectric constant (κ in the video down, credit University of Cambridge, United Kingdom) versus frequency, at the resonance frequencies of the ionic and electronic polarisation modes. A dip appears at frequencies just above each resonance peak, which is a general phenomenon of all damped resonance responses, corresponding to the response of the system being out of phase with the driving force. In this case, in the areas of the dips, the polarisation lags behind the field.
At higher frequencies the movement of charge cannot keep up with the alternating field, and the polarisation mechanism ceases to contribute to the polarisation of the dielectric. As frequency increases, the material’s net polarisation drops as each polarisation mechanism ceases to contribute, and hence its dielectric constant drops. The animation below illustrates these effects.
Exposing a beverage to an alternating electromagnetic field reveals three different polarisation mechanisms acting at the Beverage molecular level: electronic, ionic and orientational. The video shows the effect of the variation of frequency on the behaviour of each mechanism. Beverage Bottling Fill Level Controls are focused on the orientational mechanism, because applied to a polar molecule: water. The red dot in the video set in the flat horizontal zone, corresponding to the frequency of 21 MHz, commonly used by HF fill level inspectors.
At frequencies >1000000 THz (1 terahertz is equivalent to 1000 GHz) like those characterising ultraviolet, X-rays and γ-rays bands, none of the polarisation mechanisms are able to switch rapidly enough to remain in step with the field. The beverage no longer possesses the ability to polarise, and the dielectric constant drops to the same value as that of a vacuum.
This last detail here added to clear a basic difference of the High Frequency fill level inspection, with respect to other competing technologies UV, X-rays and γ-rays which on the opposite check for the absorption of energy.
Ambient conditions and HF fill level inspection
In the following, we'll examine 365 consecutive days, comprised between October 20, 2012 til October 19, 2013 of the temperature registered (data credit Vector Magic, Inc., http://vectormagic.com) in a test-place. We'll consider records at the Hartsfield-Jackson Atlanta International Airport (Atlanta, Georgia, USA). Why Atlanta ?
Because:
- has a warm humid temperate climate with hot summers and no dry season;
- is a town well known to Bottlers because hosting the Headquarters of the World greatest Company of Beverage;
- is definetely not one whose ambient conditions are subject to seasonal or daily extremes of temperature or humidity;
- the choice of this temperate site enforce the sense of the conclusions for those Bottling Lines sites which are subject to extreme seasonal or daily temperatures and humidities. Typical examples of these, being the semi-desertic or desertic places, both sharing extreme deviations on the ambient temperature along the 24 hours and along the season.
Ambient Temperature
The ambient temperature is a relevant factor along our process of measurement of the fill level. The subject is deeply treated here. In brief, the Complex vector dielectric permittivity, for an em wave ω has its imaginary component jε′′ (ω) related to the dissipation of energy within the medium. Medium is all what lies, gas, liquids, solids, in the space interested to the wave transfer of energy. Energy dissipation within the medium is related to the average molecular and bonds’ motion, say to the beverage water temperature. Dielectric permittivity ε will change continously, as temperature decrease. Knowing this relation, we’ll look at the daily Temperature data registered for last 12 months at Atlanta.
The hottest day of the 12 months period was August 29, with a high temperature of 33°C. For reference, on that day the average high temperature is 30°C and the high temperature exceeds 33°C only one day in ten. The hottest month of the last 12 months was June with an average daily high temperature of 29°C. Relative to the average, the hottest day was January 12. The high temperature that day was 23°C, compared to the average of 11°C, a difference of 13°C. In relative terms the warmest month was January, with an average high temperature of 14°C, compared to an typical value of 11°C. The longest warm spell was from January 7 to January 22, constituting 16 consecutive days with warmer than average high temperatures. The month of December had the largest fraction of warmer than average days with 74% days with higher than average high temperatures.
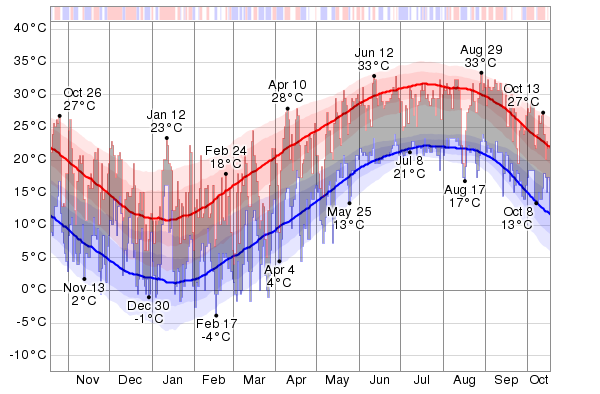
![]() The daily low (blue) and high (red) temperature during the last 12 months with the area between them shaded gray and superimposed over the corresponding averages (thick lines), and with percentile bands (inner band from 25th to 75th percentile, outer band from 10th to 90th percentile). The bar at the top of the graph is red where both the daily high and low are above average, blue where they are both below average, and white otherwise (quoted analysis and graphics credit Vector Magic, Inc.)
The daily low (blue) and high (red) temperature during the last 12 months with the area between them shaded gray and superimposed over the corresponding averages (thick lines), and with percentile bands (inner band from 25th to 75th percentile, outer band from 10th to 90th percentile). The bar at the top of the graph is red where both the daily high and low are above average, blue where they are both below average, and white otherwise (quoted analysis and graphics credit Vector Magic, Inc.)
The coldest day of the 12 months period was February 17, with a low temperature of -4°C. For reference, on that day the average low temperature is 3°C and the low temperature drops below -3°C only one day in ten. The coldest month of the last 12 months was February with an average daily low temperature of 3°C. Relative to the average, the coldest day was March 27. The low temperature that day was -1°C, compared to the average of 9°C, a difference of 10°C. In relative terms the coldest month was March, with an average low temperature of 5°C, compared to an typical value of 7°C. The longest cold spell was from February 28 to March 10, constituting 11 consecutive days with cooler than average low temperatures. The month of March had the largest fraction of cooler than average days with 71% days with lower than average low temperatures.
Ambient humidity
Humidity is an important factor in determining how much water lies in the space between the bottle’s neck and the HF bridge (an em radiator tuned at ~21 MHz). This water contributes to the beverage water lying in the neck, biasing our measurement, emulating additional beverage.
When reading the graph below (credit Vector Magic, Inc.) keep in mind that the hottest part of the day tends to be the least humid, so the daily low (brown) traces are more relevant for understanding daytime comfort than the daily high (blue) traces, which typically occur during the night. Applying that observation, the least humid month of the last 12 months was March with an average daily low humidity of 37%, and the most humid month was July with an average daily low humidity of 61%.

![]() the daily low (brown) and high (blue) relative humidity during the last 12 months with the area between them shaded gray and superimposed over the corresponding averages (thick lines), and with percentile bands. These last the inner band from 25th to 75th percentile and the outer band from 10th to 90th percentile
the daily low (brown) and high (blue) relative humidity during the last 12 months with the area between them shaded gray and superimposed over the corresponding averages (thick lines), and with percentile bands. These last the inner band from 25th to 75th percentile and the outer band from 10th to 90th percentile
High Frequency fill level inspection is the name of one of the most widespread Technologies for the control of the fill level. Its merit? It is cheap for the Vendor, due to the low cost of the hardware parts there necessary. But, when we say that it is really cheap for Vendors, we have not said that an Electronic Inspector equipped that way shall cost sensibly less than with, e.g. X-ray fill level inspection.
In other sections we’ll treat the fine-detail of the technology behind the High Frequency fill level inspection for:
- still beverages;
- foaming beverages.


